Developer Productivity
Engineering Metrics
Amartya Jha
• 30 March 2025
First Things First
Twenty years ago, measuring a software developer’s productivity often boiled down to counting lines of code or tracking how many features they shipped. The more they wrote, the more productive they were considered. But was that really the case?
In an age where software development is at the heart of almost every industry, the question isn’t just "Are developers working?" but rather "Are they working effectively?" With the rise of remote work, cross-functional teams, and DevOps, traditional ways of measuring productivity are no longer enough.
Let’s break it down.
What is Developer Productivity?
At its core, developer productivity is about delivering high-quality software efficiently and sustainably. It’s not just about speed but also effectiveness and well-being - a developer who delivers clean, maintainable code in a reasonable time frame while avoiding burnout is far more valuable than one who works long hours churning out technical debt.
True productivity balances:
Efficiency – How quickly can developers turn ideas into working software?
Effectiveness – Is the software reliable, scalable, and maintainable?
Well-being – Are developers engaged, motivated, and free from burnout?
Measuring productivity isn’t just about tracking output; it’s about understanding how developers work, what blockers they face, and how teams can be optimized for success.
Why Does Developer Productivity Matter?
For teams and organizations, developer productivity isn’t just a vanity metric - it has real business impact. Highly productive teams:
Deliver better software, faster, reducing time-to-market.
Experience fewer bugs and failures, cutting down on costly rework.
Have higher morale and retention rates, reducing hiring and training costs.
Improve cross-team collaboration, leading to smoother workflows.
In contrast, poorly optimized teams struggle with inefficiencies - long deployment cycles, unclear priorities, and frustrating workflows - all of which slow down innovation and impact company growth.
Common Misconceptions About Developer Productivity
❌ "More code = More productivity"
Writing more code doesn’t necessarily mean better results. High-quality, concise code is often more valuable than bloated, inefficient code.
❌ "More hours worked = More productivity"
Developers working long hours might seem productive, but without balance, it leads to burnout, technical debt, and reduced long-term output.
❌ "One metric can define productivity"
No single metric—be it commit count, sprint velocity, or pull request frequency—can fully capture a developer’s impact. A combination of qualitative and quantitative measures is essential.
The Need for Both Qualitative and Quantitative Measurement
Measuring productivity is tricky because it’s not just about what developers do but also how they feel about their work. That’s why we need both qualitative and quantitative approaches:
📊 Quantitative Metrics (Data-driven) – Focus on numbers like deployment frequency, bug rates, and cycle time.
🗣 Qualitative Metrics (Experience-driven) – Capture insights like developer satisfaction, collaboration, and cognitive load.
Without balancing both, organizations risk over-optimizing for output while ignoring developer experience, which can ultimately harm productivity.
So, how do we measure developer productivity effectively? Let’s explore the key frameworks and metrics that can help. 🚀
Key Productivity Frameworks
Measuring developer productivity isn’t just about counting output—it’s about impact, efficiency, and collaboration. Over time, structured frameworks have emerged to capture a more complete picture.

SPACE Framework
SPACE short for Satisfaction, Performance, Activity, Collaboration, and Efficiency - a modern framework that redefines how we measure developer productivity beyond just speed or output.
This framework - developed by researchers from GitHub, Microsoft, and the University of Victoria - challenges conventional productivity tracking. According to Forbes, SPACE encourages organizations to take a broader view by connecting different productivity metrics to organizational goals rather than measuring output in isolation. Instead of relying on outdated measures like commit counts or ticket closures, SPACE considers multiple dimensions that impact both individual and team effectiveness.
Unlike traditional approaches that equate "more code" with "more productivity," SPACE acknowledges that true productivity isn’t just about volume - it’s about effectiveness, sustainability, and collaboration. It shifts the focus from raw output to overall impact and long-term success.
Let’s break down the five dimensions of SPACE:
1. Satisfaction (and Well-Being)
Developer productivity isn’t just about work. It’s about how developers feel about their work. Satisfaction reflects engagement, motivation, and overall happiness, while well-being considers factors like burnout and work-life balance.
📏 How to measure: Conduct developer surveys, measure team morale, and track retention rates to assess well-being and job satisfaction.
2. Performance
Performance refers to the outcomes and impact of a developer's work, not just their speed. While traditional metrics track the amount of code produced, SPACE looks at the quality and results of that work.
📏 How to measure: Use code stability metrics, track customer satisfaction, and analyze bug resolution rates or feature adoption to gauge performance.
3. Activity
Activity measures developer actions, such as the number of pull requests, commits, or on-call incidents. This is the closest to traditional productivity metrics, but SPACE emphasizes that activity alone isn’t a reliable indicator of productivity.
📏 How to measure: Track commit frequency, pull request volume, and on-call incidents, but always evaluate them alongside other SPACE metrics.
4. Collaboration (and Communication)
Software development is rarely a solo effort. Effective teams require strong collaboration and communication, especially in distributed or hybrid work environments.
📏 How to measure: Assess code review participation, measure knowledge-sharing activities, and analyze team sentiment surveys for collaboration insights.
5. Efficiency (and Flow)
Efficiency focuses on how seamlessly developers can complete tasks without unnecessary friction. It looks at factors like context switching, time lost due to inefficient workflows, or interruptions.
📏 How to measure: Analyze time-on-task data, track meeting-to-work ratio, and monitor workflow bottlenecks that impact efficiency.
While SPACE offers a holistic approach, measuring these dimensions isn’t always straightforward. Qualitative metrics like satisfaction and collaboration can be subjective, while quantitative metrics like activity and efficiency can be misleading if taken in isolation. Balancing these factors requires continuous iteration and contextual understanding rather than rigid tracking.
DORA Framework
Not to be confused with other "DORA" acronyms, the DevOps Research and Assessment (DORA) framework is a widely recognized approach to measuring DevOps performance and maturity.
According to Atlassian, this framework - developed by a Google Cloud research team - was designed to help teams assess and improve their software delivery processes. DORA metrics provide a standardized way to measure DevOps efficiency, focusing on both velocity and stability rather than just speed. These metrics help organizations track how quickly they can respond to changes while maintaining system reliability.
Unlike traditional performance indicators that prioritize deployment frequency alone, DORA emphasizes a balance between fast iterations and long-term system health. By leveraging these metrics, teams can identify bottlenecks, enhance collaboration, and drive continuous improvement.
Let’s break down the four key DORA metrics:
1. Deployment Frequency
How often does your team deploy changes to production? High-performing teams ship code frequently and consistently, ensuring continuous delivery and faster iterations.
📏 How to measure: Track the number of deployments per day, week, or sprint to gauge the team's ability to deliver software efficiently.
2. Lead Time for Changes
The time it takes from writing code to getting it deployed in production. Faster lead times indicate a smooth and efficient CI/CD pipeline.
📏 How to measure: Measure the time from code commit to production deployment, helping identify delays in the development lifecycle.
3. Change Failure Rate
What percentage of changes result in failures, rollbacks, or production issues? Lower failure rates suggest a stable and reliable development process.
📏 How to measure: Track the percentage of deployments that cause system issues, helping teams improve quality assurance and testing strategies.
4. Time to Restore Service
When failures do occur, how quickly can your team resolve them? Faster recovery times indicate a strong incident management process.
📏 How to measure: Measure the average time taken to restore service after a production incident to ensure system reliability.
While DORA provides valuable insights, context matters. Metrics like deployment frequency or lead time may vary based on team size, project complexity, and company goals. Additionally, focusing solely on numbers without considering developer experience and team dynamics can lead to misinterpretation and misaligned priorities.
DORA metrics aren’t just about speed - they’re about building a culture of continuous improvement, reliability, and high-performance DevOps practices.
Interested in learning more about DORA Metrics? Read
DX Core 4 Framework
DX Core 4 is a modern framework designed to measure developer productivity holistically. It was developed by Abi Noda (CEO of DX) and Laura Tacho (CTO of DX), in collaboration with experts behind DORA, SPACE, and DevEx, including Dr. Nicole Forsgren, Dr. Margaret-Anne Storey, and Dr. Thomas Zimmerman.
Unlike traditional productivity models that focus on output, DX Core 4 integrates quantitative and self-reported metrics to assess productivity across four key dimensions. The key and secondary metrics within DX Core 4 have been outlined as per the LeadDev Report, providing a structured approach to evaluating developer productivity.
1. Speed
Measures how quickly engineering teams deliver code.
📏 Key metric: Diffs per engineer (pull/merge requests per developer).
📏 Secondary metrics: Lead time (DORA), deployment frequency (DORA), and perceived rate of delivery.
2. Effectiveness
Evaluates how efficiently developers work and their overall experience.
📏 Key metric: Developer Experience Index (DXI)—a proprietary survey-based measure of engineering performance drivers.
📏 Secondary metrics: Regrettable attrition (developer churn), time to tenth PR (onboarding efficiency).
3. Quality
Focuses on software stability and reliability.
📏 Key metric: Change failure rate (DORA).
📏 Secondary metrics: Failed deployment recovery time, perceived software quality, and operations health/security.
4. Impact
Links software development to business value.
📏 Key metric: Percentage of time spent on new capabilities vs. technical debt.
📏 Secondary metrics: Initiative progress and ROI, revenue per engineer, and R&D spending as a percentage of revenue.
DX Core 4 blends engineering, business, and human factors, ensuring a balanced and actionable approach to productivity measurement. By integrating both hard data (DORA) and self-reported insights (SPACE, DevEx), it provides a clearer picture of developer success and well-being.
McKinsey’s Approach to Measuring Developer Productivity
The article, “Yes, you can measure software developer productivity” authored by Aayush Gupta and Chandra Gnanasambandam from McKinsey & Company, argues that measuring developer productivity is critical as organizations become increasingly software-driven.
However, when applied to individual engineers’ performance, traditional metrics like lines of code produced or story points (burndown charts) often fail to provide an accurate picture. The authors propose a new approach that builds on existing industry metrics like DORA and SPACE. Their framework introduces additional “opportunity-focused” metrics, which are easier to collect through surveys and existing data sources.
Key elements of their approach include:
1) Inner/outer loop analysis
Maximizing focused time on value-adding “inner loop” coding tasks while reducing “outer loop” time spent on tasks like code reviews, integration, and testing.
📏 How to measure: Track time spent on coding vs. time spent on non-coding tasks using developer workflow analytics and self-reported data.
2) Developer Velocity Index (DVI)
A survey-based benchmark that evaluates an organization’s technology, practices, and developer enablement compared to industry peers.
📏 How to measure: Conduct regular developer surveys assessing tooling, workflow efficiency, and friction points, then benchmark against industry standards.
3) Contribution analysis
Assessing individual contributions to backlog tasks to uncover optimization opportunities.
📏 How to measure: Use task tracking systems like Jira or GitHub issues to analyze contribution patterns, such as completed tasks, PR reviews, and team collaboration metrics.
4) Talent capability scoring
Measuring skill distribution within the engineering team to pinpoint coaching and upskilling needs. This ensures that experienced developers are utilized effectively while junior engineers receive adequate support.
📏 How to measure: Conduct peer reviews, manager assessments, and track skill growth through internal learning programs and certification completion rates.
While McKinsey’s approach aims to offer a structured way to measure productivity, it has received significant criticism. Many argue that relying heavily on surveys oversimplifies engineering work. We recommend any team to first read about the criticisms of this approach before implementing it.
Key Metrics of Developer Productivity
Unlike broad frameworks like DORA, SPACE, DX Core 4, and McKinsey’s DVI, which focus on organizational impact and developer experience, the following metrics offer a customizable, data-driven approach to measuring productivity. By combining quantitative (measurable) metrics with qualitative (experience-focused) insights, teams can tailor their methodology based on specific needs—whether optimizing delivery speed, improving code quality, or balancing workload.
Quantitative Metrics (Measurable & Data-Driven)
A. Delivery & Speed Metrics
Throughput – Measures the number of features shipped and bug fixes completed.
📏 How to measure: Count the number of merged pull requests, completed user stories, or resolved tickets over a given period.Cycle Time – Tracks the time taken from task creation to deployment.
📏 How to measure: Measure the duration between when work starts and when it is completed in production.Lead Time – Assesses the time taken from commit to production.
📏 How to measure: Track the duration between code commit and deployment.Deployment Frequency – Indicates how often code is deployed.
📏 How to measure: Count the number of deployments within a set timeframe (e.g., per week or month).Velocity – Measures tasks completed per sprint.
📏 How to measure: Sum the number of completed user stories or story points in each sprint.
B. Code Quality & Stability Metrics
Bug Rate – Tracks the number of defects per release.
📏 How to measure: Count the number of reported bugs after each deployment.Change Failure Rate – Calculates the percentage of deployments causing failures.
📏 How to measure: Divide the number of failed deployments by the total number of deployments.Time to Restore Service (MTTR) – Measures how quickly issues are resolved after a failure.
📏 How to measure: Track the average time taken to resolve incidents.Code Maintainability – Assesses how easy it is to modify and maintain code.
📏 How to measure: Use static analysis tools like SonarQube to track code complexity and technical debt.Rework Rate – Indicates how often developers need to fix or redo their work.
📏 How to measure: Count the number of times a feature or task is reopened for changes.
C. Workload & Efficiency Metrics
Work in Progress (WIP) – Measures the number of active tasks at any given time.
📏 How to measure: Track the number of tasks currently in development.Task Completion Rate – Evaluates the percentage of assigned tasks that are completed.
📏 How to measure: Divide the number of completed tasks by the total assigned tasks.PR Review Time – Tracks the average time taken to review pull requests.
📏 How to measure: Measure the duration between PR submission and approval.Meeting Load – Assesses time spent in meetings versus coding.
📏 How to measure: Track time allocated to meetings versus development work using calendar data or time-tracking tools.
Qualitative Metrics (Experience & Well-being Focused)
While quantitative metrics track measurable outcomes, qualitative metrics provide insights into developer experience, satisfaction, and overall well-being. These metrics help organizations understand what impacts productivity beyond just numbers, allowing for a more balanced approach.
The article “Measuring Developer Productivity via Humans” on Martin Fowler highlights the importance of qualitative metrics, emphasizing that traditional output-based measures overlook key aspects like developer satisfaction, collaboration, and cognitive load, which significantly influence long-term productivity.
Two Types of Qualitative Metrics
Attitudinal Metrics (Subjective Feelings & Perceptions)
These capture how developers feel about their work, tools, and environment.
📝 Example: "How supported do you feel in solving technical challenges?"
Behavioral Metrics (Objective Work Experience Data)
These track real-world interactions and patterns, identifying inefficiencies.
📝 Example: "How frequently do you experience delays due to dependencies or approvals?"
A. Developer Satisfaction & Well-being
Developer Satisfaction Surveys
Extra Hours Worked – Tracking late nights and weekend work that may lead to burnout.
Disengagement Levels – Measuring response times, participation in meetings, and involvement in reviews.
Tenure & Attrition Rate – Assessing the average time developers stay in a team.
B. Collaboration & Team Dynamics
Knowledge Sharing & Pair Programming – Evaluating how often developers assist peers.
Code Review Feedback Quality – Analyzing the depth and effectiveness of feedback.
Meeting Effectiveness – Capturing developer feedback on whether meetings are productive or redundant.
C. Cognitive Load & Ease of Work
Ease of Development – Identifying barriers in coding workflows and process complexity.
Tooling & Environment Satisfaction – Understanding developer sentiment on IDEs, infrastructure, and automation tools.
Autonomy & Decision-Making – Measuring how independently developers can make technical decisions.
Tools to Measure & Improve Developer Productivity
Measuring developer productivity isn’t just about tracking output - it’s about identifying bottlenecks, streamlining workflows, improving code quality, and enhancing the overall developer experience. The right tools reduce friction, automate repetitive tasks, and help developers focus on high-impact work.
Project Management & Workflow Tracking
Effective project management tools help teams organize tasks, monitor progress, and streamline development processes.
Jira: A widely-used platform for tracking tasks, sprints, and project timelines.
Linear: Offers a user-friendly interface for managing issues and enhancing team collaboration.
ClickUp: Provides customizable workflows and integrates with various development tools to suit diverse project needs.
These tools improve productivity by reducing time spent on administrative tasks, enhancing communication, and providing clear visibility into project status.
Code Analysis & Quality Checks
Maintaining high code quality is crucial for sustainable development. Codeant AI offers an AI-driven approach to code reviews, integrating seamlessly into your Integrated Development Environment (IDE) to enhance productivity.
Key Features of CodeANT AI:
AI Pull Request Summaries
Static Code Analysis
Secret Detection & Security Checks
Infrastructure Security Checks
By automating these aspects, CodeANT AI reduces manual review efforts, allowing developers to focus more on coding and less on debugging, thereby enhancing overall productivity.
For a better, more reliable code review experience, visit CodeAnt to learn how to integrate it with your IDE.
DevOps & CI/CD Performance Monitoring
Optimizing deployment speed and system reliability is vital for high-performing teams. Tools that monitor DevOps performance using DORA metrics provide valuable insights into developer productivity analytics.
Google Cloud's Four Keys Dashboard: Google created the Four Keys open-source project, which automatically sets up a data ingestion pipeline from your GitHub or GitLab repositories through Google Cloud services and into Google DataStudio. The system aggregates data and compiles it into a dashboard that tracks key metrics over time. This enables teams to measure and improve Deployment Frequency, Lead Time for Changes, Change Failure Rate, and Mean Time to Restore Service (MTTR).
GitHub Actions: Integrates directly with GitHub repositories to automate workflows, track deployments, and monitor performance metrics.
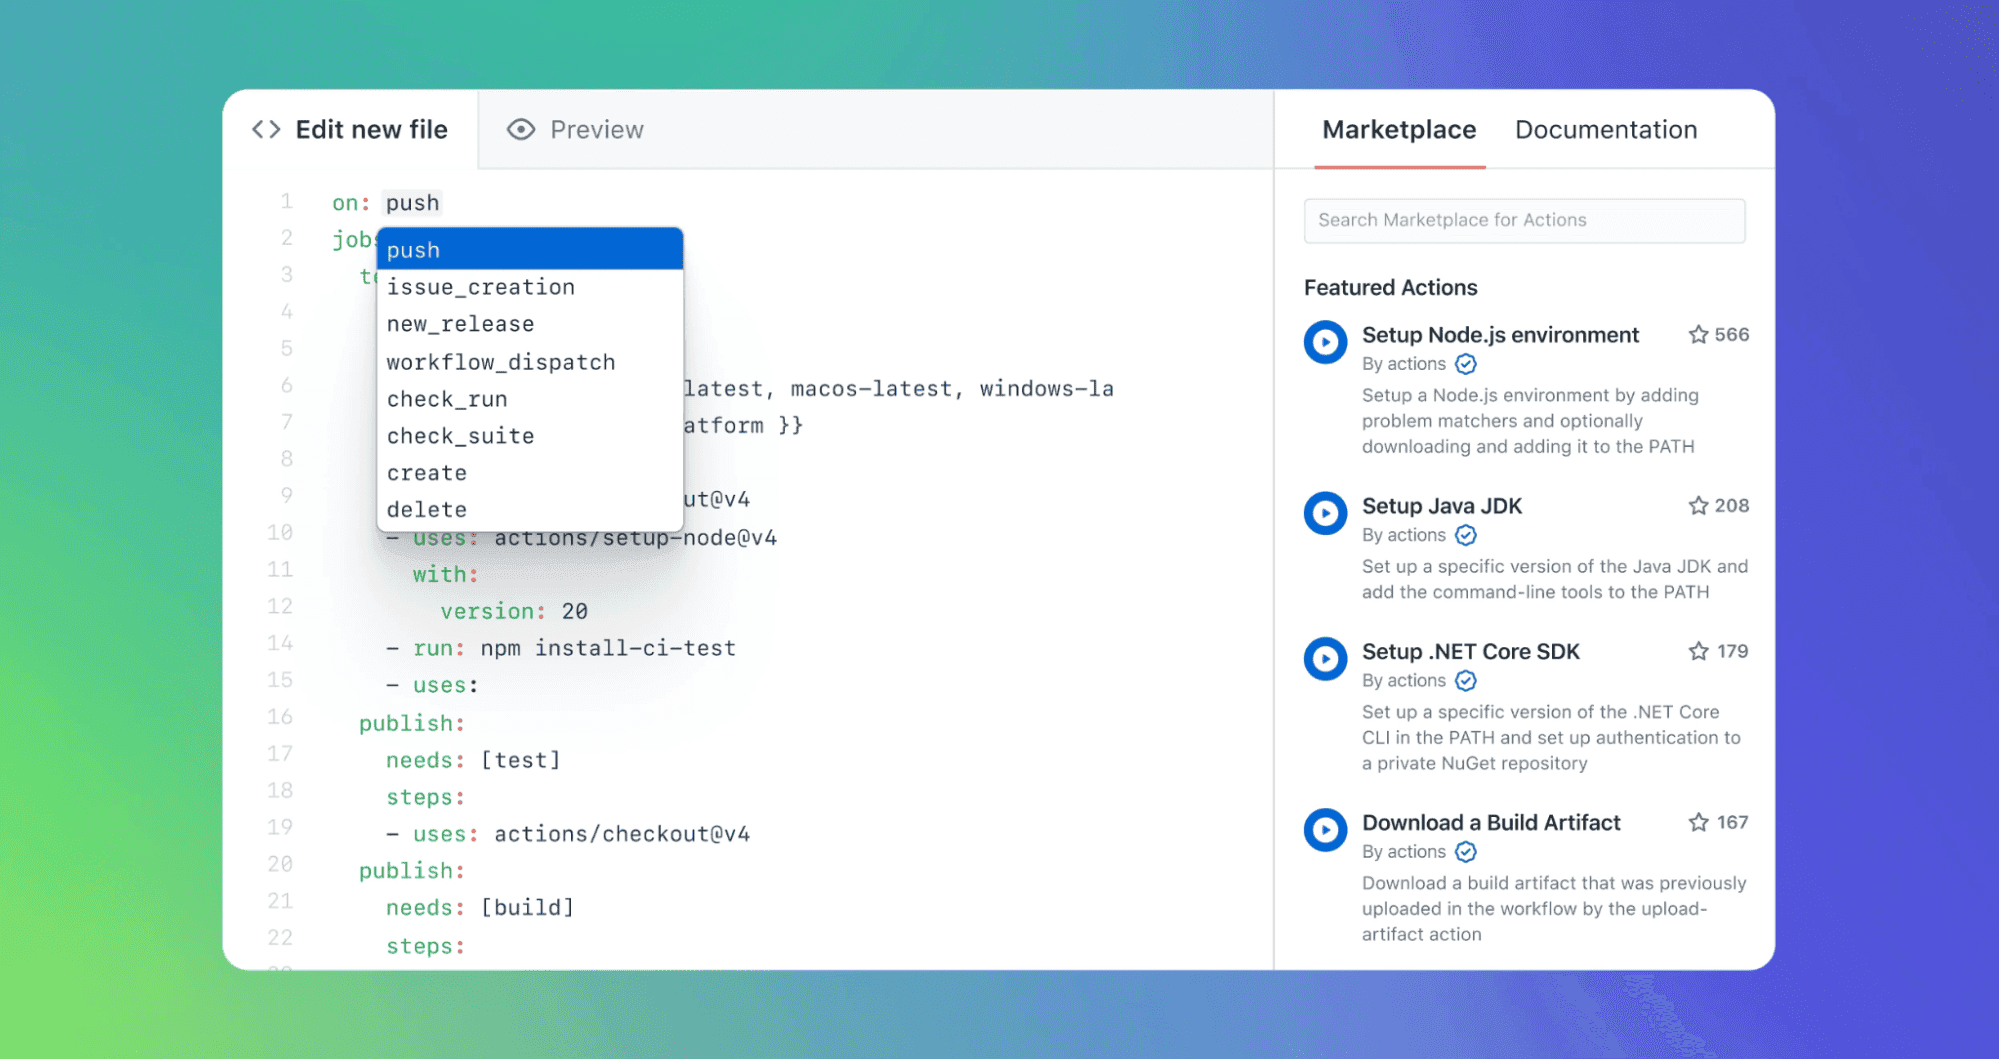
By leveraging these tools, teams can automate build, test, and deployment processes, reducing manual workload and accelerating release cycles.
Developer Experience & Well-being Assessment
Ensuring developer satisfaction and well-being is key to maintaining productivity. Tools that assess the developer experience can identify areas for improvement.
DX (Developer Experience) Score: Provides insights into developer satisfaction and highlights areas needing attention.
Internal Surveys: Custom surveys tailored to gather feedback on tools, processes, and work environment.
By regularly assessing developer experience, organizations can implement changes that lead to a more efficient and content workforce.
Selecting the appropriate tools to measure and improve developer productivity is crucial for any organization aiming to enhance software quality and team efficiency. By integrating these tools into their workflows, teams can gain a comprehensive understanding of their performance and identify opportunities for continuous improvement.
Wanna know the best AI tools to boost productivity, the best productivity tracking tools, the best developer productivity tools for agile development, the best tools to become a 10x developer? Read our guide on the Best Developer Productivity Tools in 2025
Best Practices for Improving Developer Productivity
A highly productive engineering team operates with efficiency, collaboration, and continuous improvement. The following best practices help teams streamline workflows while maintaining a healthy work environment.
1) Reduce Context Switching & Unnecessary Meetings
Developers thrive when they have uninterrupted focus time—frequent task-switching reduces efficiency.
Use clear documentation to reduce redundant explanations.
2) Foster a Healthy Team Culture
A supportive environment where developers feel safe to ask questions, suggest improvements, and take ownership leads to greater innovation.
Mentorship programs ensure junior developers learn quickly, reducing onboarding time.
Encourage autonomy by empowering developers to make decisions rather than enforcing rigid top-down control.
3) Use Automation & Better Tooling to Reduce Friction
Leverage CI/CD pipelines, infrastructure as code, and automated testing to reduce repetitive tasks.
Use Generative AI Tools to reduce manual workload and improve developer productivity.
Use AI-powered tools like CodeANT AI to automate security checks, code quality analysis, and PR reviews.
Ensure developers have high-quality hardware and optimized IDE setups to avoid slowdowns.
4) Track Progress, But Avoid Micromanaging Developers
Use outcome-driven metrics (e.g., deployment success rate, feature adoption) instead of raw activity metrics (e.g., PR count, commits).
Encourage self-reported blockers and progress updates instead of daily status meetings.
Trust developers to own their work rather than enforcing constant oversight.
Common Pitfalls to Avoid
Even with the best intentions, teams can fall into traps that reduce productivity and morale. Avoid these common mistakes to sustain long-term efficiency.
🚨 Over-relying on Raw Activity Metrics (Lines of Code, PRs, Commits)
Measuring output based on quantity instead of impact leads to code bloat and unnecessary complexity.
Instead, focus on value delivered - is the feature solving a real user problem?
🚨 Ignoring Developer Well-being and Burnout Signs
High productivity isn’t about working longer hours - developers need work-life balance to stay engaged.
Watch for increased errors, disengagement, or extended work hours as signs of burnout.
Foster a culture where breaks are encouraged, and workloads are manageable.
🚨 Not Adapting Metrics Based on Team Size, Work Culture, and Product Stage
A startup team might need to focus on shipping features quickly, while an enterprise team needs stability and scalability.
Avoid one-size-fits-all metrics - adjust based on company goals, team structure, and maturity level.
Now You Know
Measuring developer productivity requires a balanced approach—combining quantitative metrics (like cycle time and deployment frequency) with qualitative insights (developer satisfaction, collaboration). While frameworks like DORA, SPACE, and Developer Velocity Index (DVI) provide structured methodologies, teams should customize their approach based on workflows and business needs, ensuring that metrics drive improvement, not micromanagement.
By focusing on efficiency, well-being, and innovation, organizations can create an environment where developers thrive.
Start optimizing your development process with CodeAnt AI - smarter code reviews for cleaner, more secure, and production-ready software.