

Are you looking to measure how well your software development team is performing? Maybe you've heard about DORA metrics but aren't quite sure what they are or why they matter.
In this blog, we'll break down these essential DevOps measurements in simple terms.
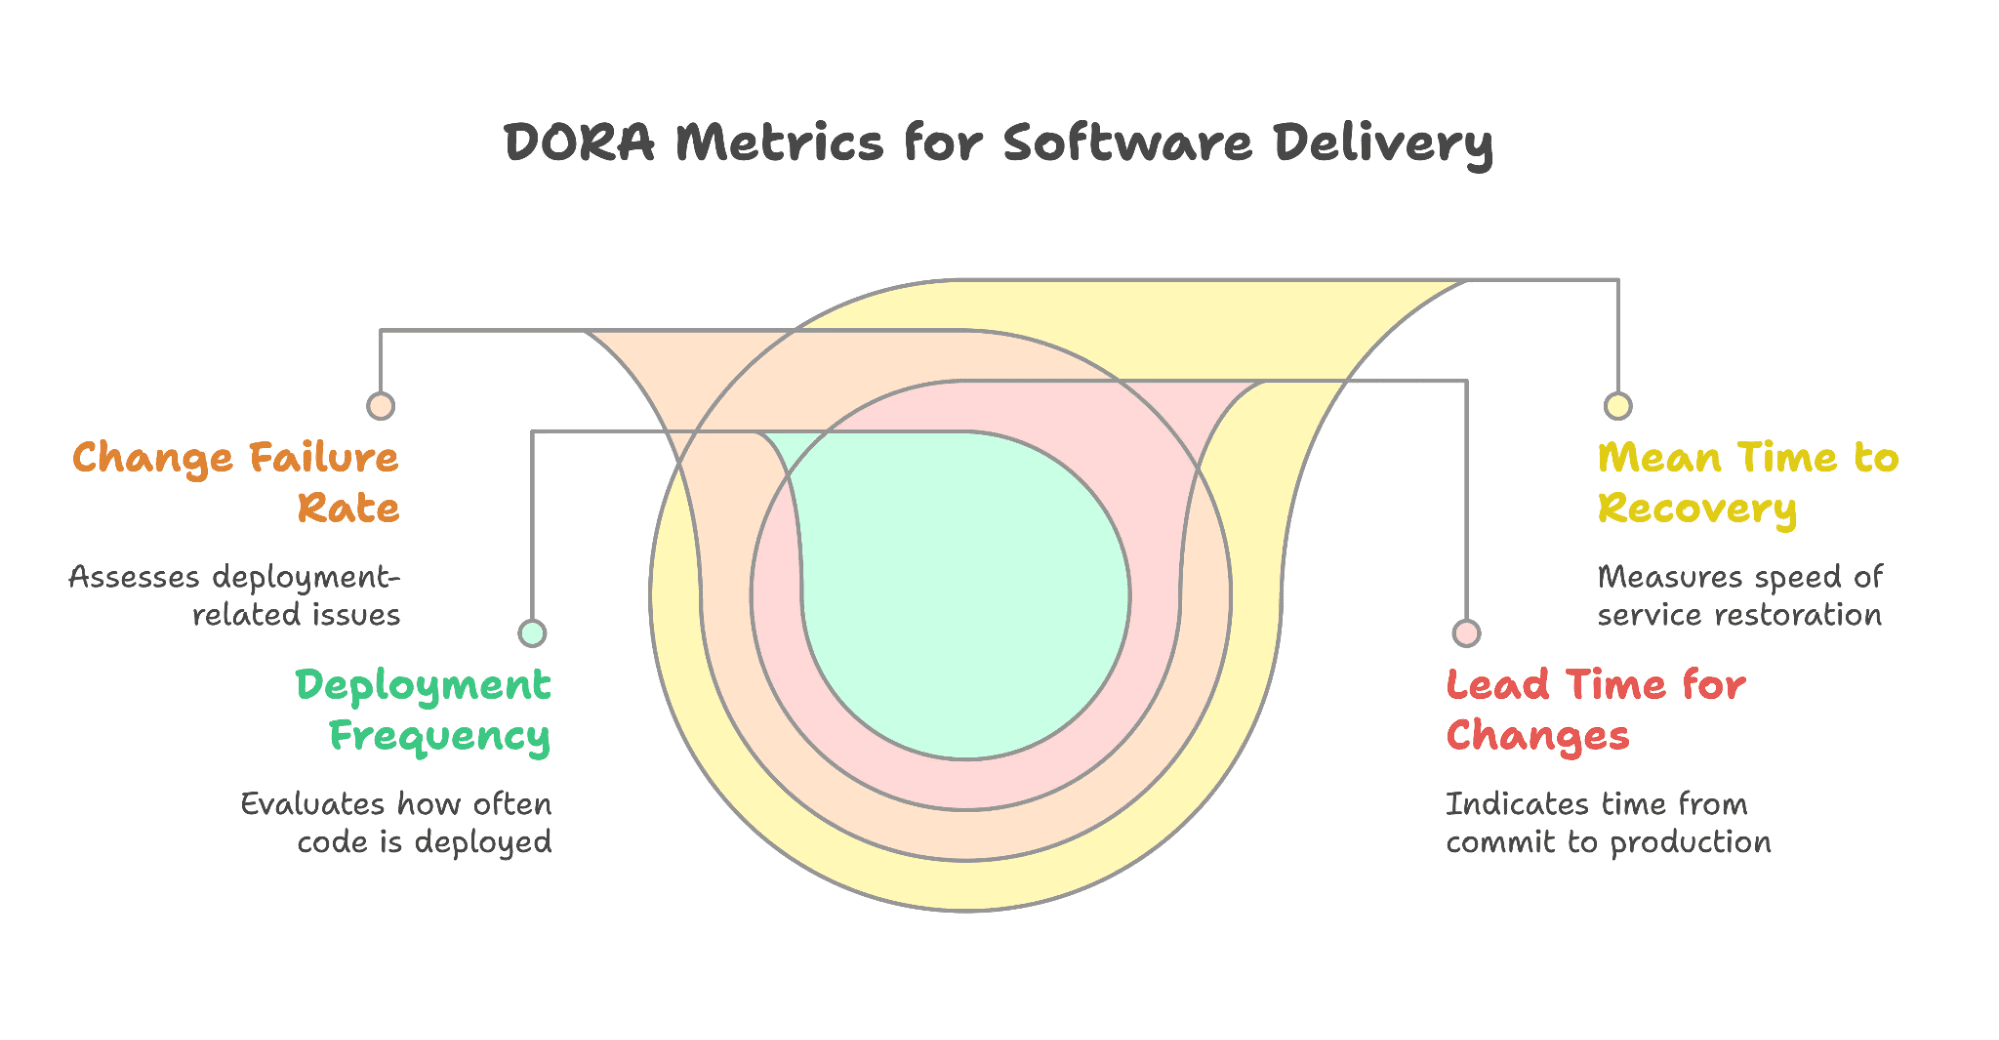
DORA (DevOps Research and Assessment) metrics are four key performance indicators
Deployment Frequency,
Lead Time for Changes,
Change Failure Rate, and
Mean Time to Recovery
that help engineering teams measure their software delivery performance.
Born from years of research by the DORA team (now part of Google Cloud), these metrics have become the gold standard for evaluating DevOps success.
High-performing engineering teams don't just rely on gut feelings, they use data to drive improvements. That's exactly what DORA metrics provide: a clear framework to understand where your team stands and how to get better.
Throughout this blog, we'll explore each metric in detail, explain why they matter, and share practical ways to track and improve them.
The Four Key DORA Metrics
Let's dive into the four metrics that can transform how you understand and improve your software delivery pipeline. Each metric offers unique insights into different aspects of your development process.
2.1 Deployment Frequency (DF)
What is it? Deployment Frequency measures how often your team successfully deploys code to production. It answers the fundamental question: "How frequently are we delivering value to our users?"
This metric is critical because higher deployment frequencies generally indicate smaller, less risky changes that can be tested more thoroughly and rolled back more easily if issues arise. It's a key indicator of your team's velocity and agility.
According to Google's 2023 State of DevOps Report, the industry benchmarks for deployment frequency are:
Elite performers: Multiple deploys per day (on-demand deployment)
High performers: Between once per day and once per week
Medium performers: Between once per week and once per month
Low performers: Less than once per month
How to improve your deployment frequency:
Break down large features into smaller, independent changes that can be delivered incrementally
Implement comprehensive automated testing to ensure quality without manual bottlenecks
Adopt feature flags to separate code deployment from feature activation
Streamline your CI/CD pipeline to reduce friction in the deployment process
Foster a culture that values small, frequent changes over massive releases
Practice trunk-based development rather than long-lived feature branches
2.2 Lead Time for Changes (LTC)
What is it? Lead Time for Changes measures how long it takes for a code change to go from commit to successfully running in production. This is essentially your "time to market" for new features or fixes.
This metric directly reflects your team's ability—how quickly you can respond to customer needs, market changes, or critical issues. When your lead time is short, you can experiment more, learn faster, and adapt to feedback quickly.
The industry benchmarks across performance levels are:
Elite performers: Less than one hour
High performers: Between one hour and one day
Medium performers: Between one day and one week
Low performers: Between one week and one month (or longer)
How to reduce your lead time:
Automate your manual approval and deployment steps wherever possible
Implement trunk-based development to reduce complex merging operations
Reduce approval bottlenecks by distributing code review responsibilities
Create smaller, focused pull requests that are easier and faster to review
Pre-approve certain types of low-risk changes (like documentation updates)
Make code reviews a daily priority for all team members
Optimize your build and test automation to run faster without sacrificing quality
Use parallel testing strategies to speed up test execution
2.3 Change Failure Rate (CFR)
What is it? Change Failure Rate measures the percentage of deployments that result in a failure requiring remediation (like a hotfix, rollback, or patch).
Simply put: "How often do our deployments cause problems?"
This metric directly impacts your system reliability, user experience, and team morale. Every failed deployment means unexpected work for your team, potential disruption for users, and lost opportunity cost as you fix issues instead of building new features.
According to DORA research, the benchmark performance levels are:
Elite performers: 0-15% failure rate
High performers: 0-15% failure rate
Medium performers: 16-30% failure rate
Low performers: Over 31% failure rate
What causes high failure rates?
Inadequate test coverage or quality
Manual deployment processes prone to human error
Inconsistent development and production environments
Poor monitoring that fails to catch issues early
Rushing changes without proper review or testing
Complex, monolithic architectures that make changes riskier
Best practices to lower your change failure rates:
Implement a comprehensive testing strategy (unit, integration, end-to-end)
Use production-like staging environments to catch environment-specific issues
Adopt progressive deployment techniques like blue-green deployments or canary releases
Create thorough code review checklists and automated quality gates (try CodeAnt.ai to automate this)
Implement pre-deployment checklists with clear acceptance criteria
Improve observability with better monitoring and alerting
Practice chaos engineering to proactively identify system weaknesses
2.4 Mean Time to Recovery (MTTR)
What is it? Mean Time to Recovery measures how quickly your team can restore service when a production incident or failure occurs. It answers the critical question: "When things break, how fast can we fix them?"
This metric is crucial because incidents will inevitably happen despite your best efforts. What separates elite teams is their ability to recover quickly and minimize impact on users and the business.
The industry benchmarks for recovery time show significant variation:
Elite performers: Less than one hour
High performers: Less than one day
Medium performers: Between one day and one week
Low performers: More than one week
Techniques to reduce recovery time:
Implement automated rollback for immediate recovery
Create detailed incident response playbooks for common failure scenarios
Use feature flags to disable problematic features without full rollbacks
Improve system observability with comprehensive logging, monitoring, and tracing
Maintain up-to-date documentation of system architecture and dependencies
Conduct blameless postmortems to learn from incidents rather than assign blame
Why Are DORA Metrics Important?

DORA metrics matter because they show you what's actually happening in your development process, not what you think is happening.
They're the difference between saying "I feel like we're shipping slower lately" and knowing "Our lead time has increased by 40% this quarter."
1. Enhancing DevOps Efficiency and Software Delivery
The sinking feeling when a release takes forever to get out the door? DORA metrics pinpoint exactly where your process is breaking down.
The beauty is in their simplicity. Four numbers tell you if you're:
Getting features to users quickly (deployment frequency and lead time)
Keeping things stable (change failure rate)
Fixing issues fast when they happen (time to restore)
These metrics don't lie.
If your deployment frequency is dropping, no amount of sprint planning improvements will fix the underlying problem. DORA metrics force you to address the real bottlenecks – whether it's your approval process, test coverage, or deployment automation.
2. Connecting Business Success to Technical Performance
Here's what makes DORA metrics different – they tie directly to business outcomes that everyone cares about.
When marketing wants that critical feature yesterday, your lead time metric explains why it takes as long as it does. When the CEO questions why competitors seem more nimble, your deployment frequency shows exactly how often you can adapt to market changes.
These metrics bridge the communication gap between technical and business teams. They transform abstract technical concepts into business impact:
High deployment frequency means you can respond to market opportunities faster
Short lead times let you experiment more and learn from real users
Low failure rates reduce customer frustration and support costs
Quick recovery times minimize the impact when things go wrong
3. Benchmarking Against Industry Standards
DORA metrics give you something rare in software development – context.
The difference between "good" and "needs improvement" isn't subjective anymore.
When you see that elite teams deploy on-demand while you're still doing monthly releases, it's a wake-up call. The benchmarks show you what's possible, not just what's normal in your organization.
This context helps set realistic targets.
Instead of arbitrary goals like "ship faster," you can aim to move from low to medium performance in specific metrics based on research across thousands of teams.
The competitive advantage here is clear – organizations that excel in these metrics outperform their peers in both technical and business outcomes.
4. Enabling Truly Data-Driven Decisions
The most powerful aspect of DORA metrics is how they cut through opinions and assumptions.
When someone suggests a process change, you don't have to debate in the abstract.
Just ask: "How will this affect our four key metrics?" Then measure the results.
These metrics help you:
Prioritize the right improvements (focus on your weakest metric first)
Make informed technology investments (will that new tool actually improve your metrics?)
Track progress objectively (are we actually getting better or just feeling busier?)
Build consensus across teams (everyone agrees faster recovery time is better)
The metrics create a virtuous cycle – measure, improve, validate, repeat. Each improvement builds on the last, creating compound benefits that separate elite performers from everyone else.
Most importantly, DORA metrics keep you honest. They reveal whether your DevOps transformation is delivering real results or just creating the illusion of progress.
3 Best Tools to Track and Measure DORA Metrics
Looking to actually improve your development process instead of just collecting more data? After testing dozens of tools and speaking with teams who've successfully transformed their metrics, I've identified three standouts that deliver real results. Each takes a unique approach to helping you measure and improve your DORA metrics.
1. CodeAnt.ai
Ever had a critical bug slip into production because someone missed it in code review? CodeAnt.ai works like having an extra senior developer on your team who never gets tired, distracted, or overlooks details.
Key Features:
AI code reviewer that catches issues human reviewers often miss
Smart auto-fixing that handles repetitive issues without developer time
Real-time feedback during development (not just during PR reviews)
Language-specific intelligence for over 30 programming languages
Pros:
Dramatically reduces the "wait for review" bottleneck that kills lead times
Catches subtle bugs that would otherwise cause production failures
Enforces consistent standards across your entire codebase
Frees up senior developers from endless review cycles
Cons:
As-of-now doesn't directly measure all DORA metrics.
Pricing:
14-day free trial with no credit card required. $10/dev/month for AI Code review plan, and Code security and quality platforms starting from $15/dev/month.
Integrations:
GitHub, GitLab, Bitbucket, VS Code, JetBrains IDEs, and most CI systems
2. Port.io
Port.io solves the "where is everything?" problem that plagues growing engineering teams. Instead of digging through wikis, docs, and Slack threads, developers get a central hub that makes self-service the default.
Key Features:
Visual software catalog that maps your entire tech ecosystem
Quality scorecards that highlight risky services needing attention
Developer self-service portal for common operations
No-code workflow builder for automating repetitive tasks
Pros:
Significantly reduces context-switching that slows development
Enables junior developers to safely perform previously complex operations
Creates visibility into technical debt and service health
Scales beautifully as your organization grows
Cons:
Requires initial investment to populate your service catalog
Value increases with team size (less impactful for very small teams)
Focuses more on enabling improvements than measuring metrics
Pricing:
Genuinely useful free tier supporting up to 15 users. Pro plan from $30/dev/month.
Integrations:
Kubernetes, AWS, GCP, Azure, GitLab, Jira, PagerDuty, and 50+ other tools
3. Faros AI
If you've ever been asked "how are we actually doing compared to similar companies?", Faros AI gives you the answer. It's like having a DevOps consultant permanently analyzing your metrics and suggesting improvements.
Key Features:
Industry benchmarking that shows how you compare to peers
Purpose-built DORA metrics dashboards with historical tracking
Bottleneck identification across your entire development process
Custom metrics, beyond the standard DORA set
Pros:
Provides concrete, actionable recommendations for improvement
Connects technical metrics to business outcomes
Helps justify DevOps investments to non-technical leadership
Identifies patterns human analysis would miss
Cons:
Requires connecting multiple data sources for maximum value
Takes time to build up enough historical data for trend analysis
Higher learning curve than simpler single-purpose tools
Pricing:
Starts at $29 per contributor with custom enterprise plans available.
Integrations:
Connects to virtually everything in your development pipeline, from issue trackers to CI/CD, source control, incident management, and more
While these three tools lead the pack, they're not the only options for tracking DORA metrics. Your ideal solution depends on your team's specific pain points and technical environment.
And that is why a must read -> Top 15 DORA Metric Tools for DevOps Success.
DORA Metrics and Developer Productivity (DX)
This is how DORA metrics affect developer experience and morale:
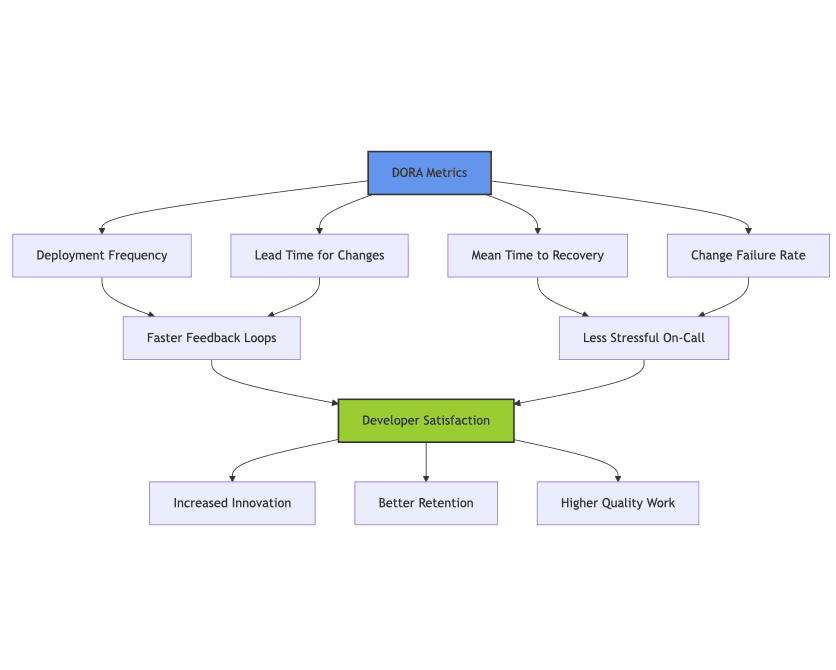
The Virtuous Cycle
When teams improve their DORA metrics, they create a positive feedback loop for developers:
Metric Improvement | Developer Experience Benefit |
|---|---|
↑ Deployment Frequency | Less waiting to see work in production; faster validation of ideas |
↓ Lead Time | Reduced context-switching between tasks; more flow state |
↓ Mean Time to Recovery | Less midnight firefighting; lower stress levels |
↓ Change Failure Rate | Fewer interruptions; more time for creative work |
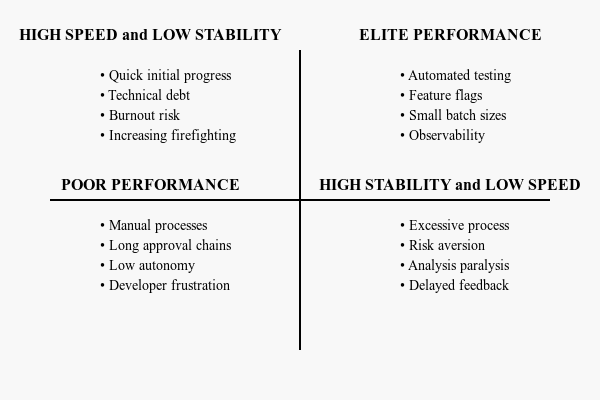
Balancing Speed with Sustainable Development
The Sustainability Matrix
Key Investments for Sustainable Development
Continuous Integration/Deployment Pipelines Initial cost: High | Long-term benefit: Transformative
Test Automation Initial cost: Medium | Long-term benefit: High
Feature Flags Initial cost: Medium | Long-term benefit: High
Observability Tools Initial cost: Medium | Long-term benefit: High
Blameless Postmortems Initial cost: Low | Long-term benefit: Transformative
Avoiding Misuse of DORA Metrics for Individual Performance
Team Metric | NOT |
|---|---|
Deployment Frequency | Developer Speed |
Lead Team for Changes | Developer Efficiency |
Mean Time to Recovery | Developer Debugging Skills |
Change Developer Rate | Developer Quality |
Healthy vs. Harmful Approaches
Healthy Approach | Harmful Approach |
|---|---|
Using metrics to identify system bottlenecks | Ranking developers based on metrics |
Celebrating team-wide improvements | Creating individual metric targets |
Investing in tools that improve metrics | Pressuring developers to "move faster" |
Running blameless postmortems | Finding who to blame for failures |
Treating metrics as signals, not targets | Optimizing for metrics at all costs |
Conclusion
DORA Metrics give you clear visibility into your development process. By measuring deployment frequency, lead time, failure rate, and recovery time, you can make data-driven decisions that improve both speed and stability.
The best teams know that these metrics aren't just numbers—they directly impact your ability to deliver value to customers and respond to market changes quickly.
Improving these metrics requires addressing code quality at its source.
This is where CodeAnt AI helps your DORA journey:
Automated code reviews catch issues before they impact your failure rate
AI-powered PR summaries cut review time, improving lead time and deployment frequency
Better code quality means faster recovery when problems do occur
Elite performers don't just measure differently—they build differently, with tools that systematically improve their process.
Ready to see results? Start tracking your DORA Metrics and try CodeAnt AI free for 14 days to see immediate improvements across all four metrics.

