

Your scanner returned 4,000 findings. About 2,400 of them are rated High or Critical. Your team can remediate perhaps forty this month. That arithmetic is the entire problem, and severity scoring alone does not solve it.
A CVSS score describes how bad a vulnerability would be if exploited. It says nothing about whether anyone will ever exploit it.
This guide covers the three data sources that actually answer that question, how they differ, and how to combine them into a rule your team can run on Monday.
That arithmetic isn't a one-off bad quarter, either. a16z's own tracking shows CVE volume growing roughly 10x from 2025 to 2026, so the 4,000-finding scanner report is only going to get longer. It's the same asymmetry that makes vulnerability management hard everywhere: an attacker needs one of those 4,000 to be both real and reachable. You have to figure out which one, out of all 4,000, before they do.
Where this connects to your stack: CodeAnt AI correlates all three signals inside attack surface management, across dozens of data sources including the National Vulnerability Database, the CISA Known Exploited Vulnerabilities catalog, and EPSS scoring. This article is the reasoning behind that correlation, written so you can apply it with any tooling.
What is Vulnerability Prioritization?
Vulnerability prioritization is the practice of ranking known vulnerabilities by the risk they pose to your specific environment, so that limited remediation capacity goes to the findings that matter. It exists because two numbers never match. The number of vulnerabilities disclosed each year runs into the tens of thousands. The number any single team can fix runs into the hundreds.
The naive approach sorts by severity and works down the list. That fails for a structural reason worth stating plainly. Severity is a property of the vulnerability. Risk is a property of the vulnerability in your environment, exposed to actual adversary behaviour. Sorting by severity alone optimises for the wrong variable.
Three public data sources give you the missing variables. Each answers a different question and none of them is sufficient alone.
Source | Question it answers | Maintained by |
|---|---|---|
CVSS | How bad would this be if exploited? | FIRST |
EPSS | How likely is exploitation in the near term? | FIRST |
CISA KEV | Is this being exploited right now? | CISA |
What is a CVSS Score?
CVSS stands for the Common Vulnerability Scoring System. It is an open standard maintained by FIRST that produces a numeric severity rating from 0.0 to 10.0 for a given vulnerability.
The score is not a single opinion. It is computed from a defined set of metrics, which is what makes it comparable across vendors and researchers.
The CVSS severity ratings
Score | Rating |
|---|---|
0.0 | None |
0.1 to 3.9 | Low |
4.0 to 6.9 | Medium |
7.0 to 8.9 | High |
9.0 to 10.0 | Critical |
What the base metrics actually measure
The Base score, which is the number you almost always see quoted, is built from two groups of metrics.
Group | Metric | What it captures |
|---|---|---|
Exploitability | Attack Vector | Whether the vulnerability is network-reachable or requires physical presence |
Exploitability | Attack Complexity | Whether conditions outside the attacker's control are required |
Exploitability | Privileges Required | What access level the attacker must already have |
Exploitability | User Interaction | Whether the attacker must persuade someone else to act |
Impact | Confidentiality, Integrity, Availability | What happens to the system when the exploit works |
Two things worth knowing before you compare scores.
CVSS v4.0 restructured this. The old Scope metric was replaced by separate impact metrics for the vulnerable system and for subsequent systems, and the Temporal group was renamed Threat.
Many tools still report v3.1. Check which version a score refers to before comparing two numbers.
What a CVSS score does not tell you
This is where teams go wrong, so it is worth being blunt about the limits.
A Base score deliberately excludes your environment. It does not know whether the affected component is deployed, reachable from the internet, or behind three other controls. It also excludes adversary behaviour entirely. A theoretically devastating flaw in software nobody attacks scores identically to one under active mass exploitation.
CVSS provides Temporal and Environmental metric groups precisely to address this. They go largely unused, because populating them requires per-asset work at a scale few teams can sustain. The result is a well-known distribution problem.
A large share of all published CVEs score 7.0 or above, so "fix everything High and Critical" is not a prioritization strategy. It is a restatement of the backlog.
What is EPSS?
EPSS stands for the Exploit Prediction Scoring System. It is maintained by FIRST and it answers a completely different question from CVSS.
An EPSS score is a probability between 0 and 1 that a given CVE will be exploited in the wild within the next thirty days. Scores are recomputed daily.
How EPSS works
EPSS is a machine learning model trained on observed exploitation data. It ingests features associated with each CVE, including vulnerability characteristics, the existence of public exploit code, references, vendor, and observed activity, and outputs a probability.
Two numbers are published per CVE and they are frequently confused. The probability is the direct model output. A score of 0.10 means roughly a ten percent chance of observed exploitation in the next thirty days. The percentile is where that CVE ranks against all others. A percentile of 0.95 means the CVE scores higher than ninety-five percent of all scored CVEs.
Use the probability for absolute decisions and the percentile for relative ranking. Reporting a percentile as if it were a probability is a common and consequential error.
Why EPSS changes the arithmetic
The base rate of exploitation is low. Only a small fraction of published CVEs are ever observed being exploited in the wild. That means severity-first prioritization spends most of its effort on vulnerabilities nobody will ever attack.
EPSS is the correction, because it lets you exclude the large low-probability mass and concentrate on the tail. The critical caveat is that EPSS is a prediction, not an observation. A low score is not a guarantee of safety, and a targeted attack against your organisation specifically is exactly the case a population-level model handles worst.
Where EPSS falls short
EPSS answers one specific question well: how likely is this CVE to be exploited across the broader ecosystem in the next 30 days? It does not, and structurally cannot, answer a narrower and often more important one: how likely is someone to target my organization with this vulnerability specifically?
Three situations expose that gap directly.
Targeted attacks against a specific organization. EPSS is trained on ecosystem-wide exploitation signal. An adversary who has already chosen your company as a target isn't part of that population average, and a low EPSS score provides no protection against them.
Vulnerabilities in unusual or private configurations. EPSS learns from public exploitation patterns. A vulnerability in a rarely-deployed configuration, or one exposed only through a non-standard integration, has little public signal for the model to learn from either way.
Newly emerging exploitation before enough evidence exists. EPSS scores update daily, but the model still needs observable signal to move. In the earliest hours after a new exploit starts circulating, the score can lag the real risk by a meaningful margin.
None of that makes EPSS less useful. It makes it exactly what it claims to be, a population-level prediction, and a reason it belongs alongside CISA KEV and reachability rather than in place of them.
What is the CISA KEV Catalog?
The CISA Known Exploited Vulnerabilities catalog is a list of vulnerabilities with reliable evidence of active exploitation in the wild. It is maintained by the United States Cybersecurity and Infrastructure Security Agency.
Note the disambiguation, because it costs people time. In this context KEV means Known Exploited Vulnerabilities. It is unrelated to any other use of those three letters.
The inclusion criteria
A vulnerability enters the catalog only when three conditions are met.
It has an assigned CVE ID.
There is reliable evidence of active exploitation in the wild.
There is a clear remediation action available, typically a vendor patch.
That third criterion matters. The catalog is designed to be actionable, so a vulnerability with no available fix generally does not appear.
Why KEV outranks both other signals
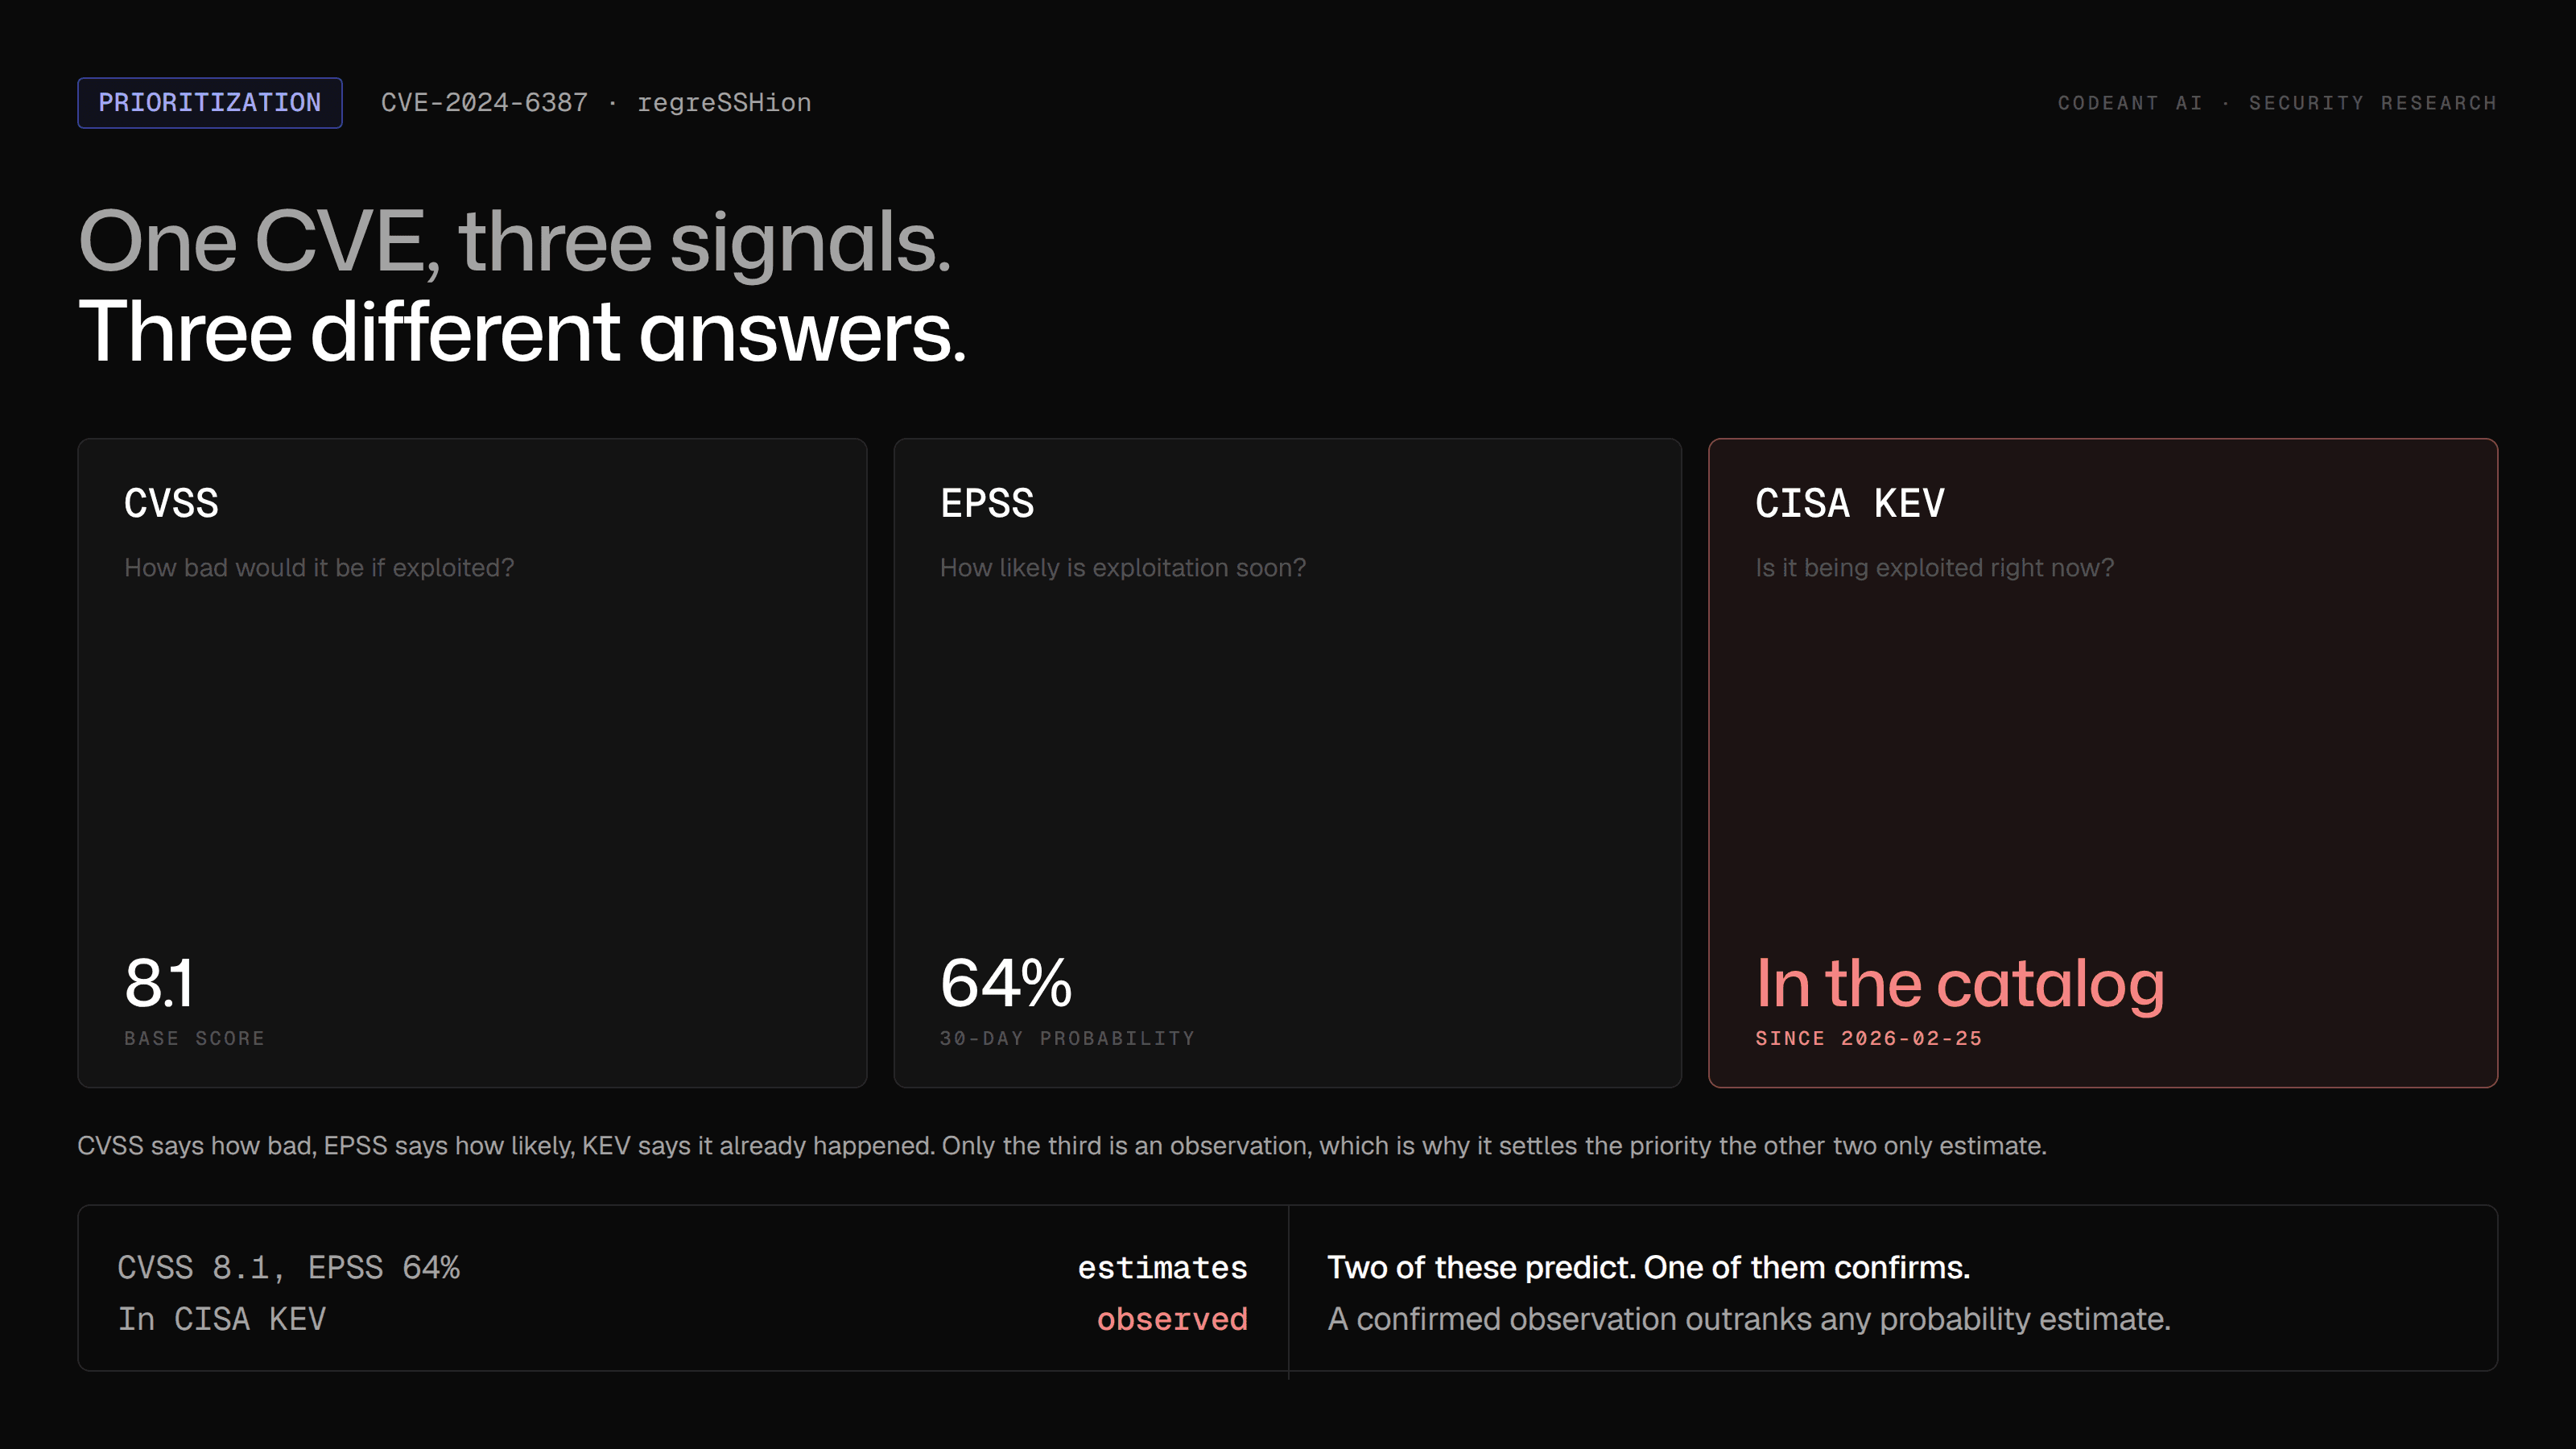
CVSS is theoretical. EPSS is predictive. CISA KEV is observational. If a CVE is in the catalog, the question of whether anyone exploits it has been answered empirically. No probability estimate improves on a confirmed observation.
The catalog also carries regulatory weight. Under Binding Operational Directive 22-01, United States federal civilian executive branch agencies are required to remediate catalogued vulnerabilities by specified due dates.
Many private organisations have adopted the same standard voluntarily, because it is the clearest available definition of "urgent". The limitation is coverage. The catalog contains only what CISA has confirmed, which means it is authoritative when a CVE appears and silent rather than reassuring when one does not.
How CVSS, EPSS, and CISA KEV Compare
Dimension | CVSS | EPSS | CISA KEV |
|---|---|---|---|
Question | How bad if exploited? | How likely to be exploited? | Is it exploited? |
Output | 0.0 to 10.0 severity | 0 to 1 probability | Binary, in or out |
Nature | Deterministic formula | Statistical prediction | Empirical observation |
Update cadence | On publication or revision | Daily | As confirmed |
Environment-aware | Only via unused optional metrics | No | No |
Coverage | Nearly all CVEs | Nearly all CVEs | Small confirmed subset |
Best use | Sizing consequence | Excluding the improbable mass | Defining urgent |
Failure mode | Treats theoretical as urgent | Misses targeted attacks | Silence is not safety |
The single most useful sentence to take from that table. CVSS tells you how bad, EPSS tells you how likely, and CISA KEV tells you it already happened.
None of the three tells you whether the affected component is actually reachable in your environment. That gap is addressed later in this article, and it's the same gap covered in more depth in CodeAnt's CVE and NVD data guide and its guide to SBOM formats and the binary gap.
Three Vulnerabilities, Three Very Different Priorities
The framework is easier to trust once you watch it disagree with intuition. Here are three vulnerabilities that could plausibly land in the same weekly scan.
Vulnerability | CVSS | EPSS | CISA KEV | Environment | Priority |
|---|---|---|---|---|---|
A | 9.8 | 0.02 | No | Internal only, not reachable from any exposed path | P3 |
B | 7.5 | 0.72 | No | Internet-facing, on the primary request path | P1 |
C | 7.2 | 0.35 | Yes | Internet-facing | P0 |
Vulnerability A looks terrifying on paper. A 9.8 is about as bad as CVSS gets. But it sits on a component that isn't deployed on anything exposed, and the vulnerable code path isn't reachable from anywhere an attacker can start. Deployment status is a gate, not a tiebreaker, so this drops to routine patch-cycle territory regardless of the headline number.
Vulnerability B has a lower CVSS and wins anyway. A 7.5 is High, not Critical. But it's sitting on the primary request path of an internet-facing service, and EPSS puts a 72% probability of exploitation in the next 30 days on it. Severity alone would have ranked this below A. Likelihood and exposure together say otherwise.
Vulnerability C settles the argument immediately. The CVSS and EPSS numbers are both moderate. It doesn't matter. CISA KEV confirms this one is already being exploited somewhere, which converts the question from prediction to observation. Observation wins. Checking that status against a live, current source, like CodeAnt's vulnerability database, matters more here than in the other two rows, because a stale KEV feed is the one input in this table where being a day behind changes the priority outright.
Run any of the three signals alone and you get a different, worse answer for at least one of these rows. That's the actual argument for combining them, not a hypothetical.
The Fourth Signal Your Scanner Doesn't Give You
CVSS, EPSS, and CISA KEV answer three questions. There's a fourth question none of them touch, and it's the one that decided two of the three rows in the table above.
CVSS asks how bad it could be. EPSS asks how likely exploitation is, across the whole ecosystem. CISA KEV asks whether exploitation has already been confirmed somewhere. Reachability asks a narrower and more useful question: can an attacker actually get to this specific vulnerable code, in your specific environment, from somewhere they can already stand?
That question has no public feed, because it depends entirely on your architecture, your routing, and your deployment, none of which any external data source can see.
A vulnerability can score 10.0, carry a high EPSS probability, and still be irrelevant to your production environment if the vulnerable code is never reachable. The inverse holds just as often: a medium-severity finding deserves immediate attention if an attacker can reach it directly from an internet-facing application and chain it into sensitive data, the exact shape of vulnerability B above, and the exact argument made throughout CodeAnt's IDOR guide for why authorization bugs routinely outrank higher-CVSS findings in real audits.
Why a CVSS 10 isn't automatically your highest priority
Worth stating as plainly as the number itself gets quoted, because the number alone answers none of these:
CVSS 10 does not mean actively exploited. CVSS 10 does not mean deployed. CVSS 10 does not mean internet-facing. CVSS 10 does not mean reachable. CVSS 10 does not mean it has a path to sensitive data.
A maximum score describes worst-case impact under ideal attacker conditions. Whether those conditions exist in your environment is a separate question, and it's the question this entire article is actually about.
How to Combine All Three into One Prioritization Rule
Here is a defensible tiering that a team can implement without a data science function. Treat the thresholds as starting points to calibrate against your own remediation capacity.
Tier | Condition | Target |
|---|---|---|
P0 | In CISA KEV, and the component is deployed | Emergency change, days |
P1 | EPSS probability at or above 0.10, and CVSS 7.0 or above | Current sprint |
P2 | EPSS at or above 0.10, or CVSS 9.0 or above | Next sprint |
P3 | CVSS 7.0 or above, EPSS below 0.10 | Routine patch cycle |
P4 | Everything else | Batch, or accept with a documented reason |
Four notes on applying it.
Calibrate the EPSS threshold to your capacity, not to a blog post. Sort your backlog by EPSS descending, walk down until you hit the number of items you can genuinely fix per cycle, and use that score as your line.
Deployment status is a gate, not a tiebreaker. A CISA KEV entry for software you do not run is not a P0. It is not a finding at all.
Re-run the scoring on a schedule. EPSS changes daily and the CISA KEV catalog grows continuously. A priority assigned three months ago is stale by construction, and the direction of travel is usually upward.
Record acceptances explicitly. P4 with a documented reason is a decision. P4 because nobody looked is an unmanaged risk wearing a tier label.
How to Prioritize 4,000 Vulnerabilities in Practice
The tiering rule above is the logic. Here's the same logic run as a sequence, in the order it actually needs to happen, closing the loop this article opened.
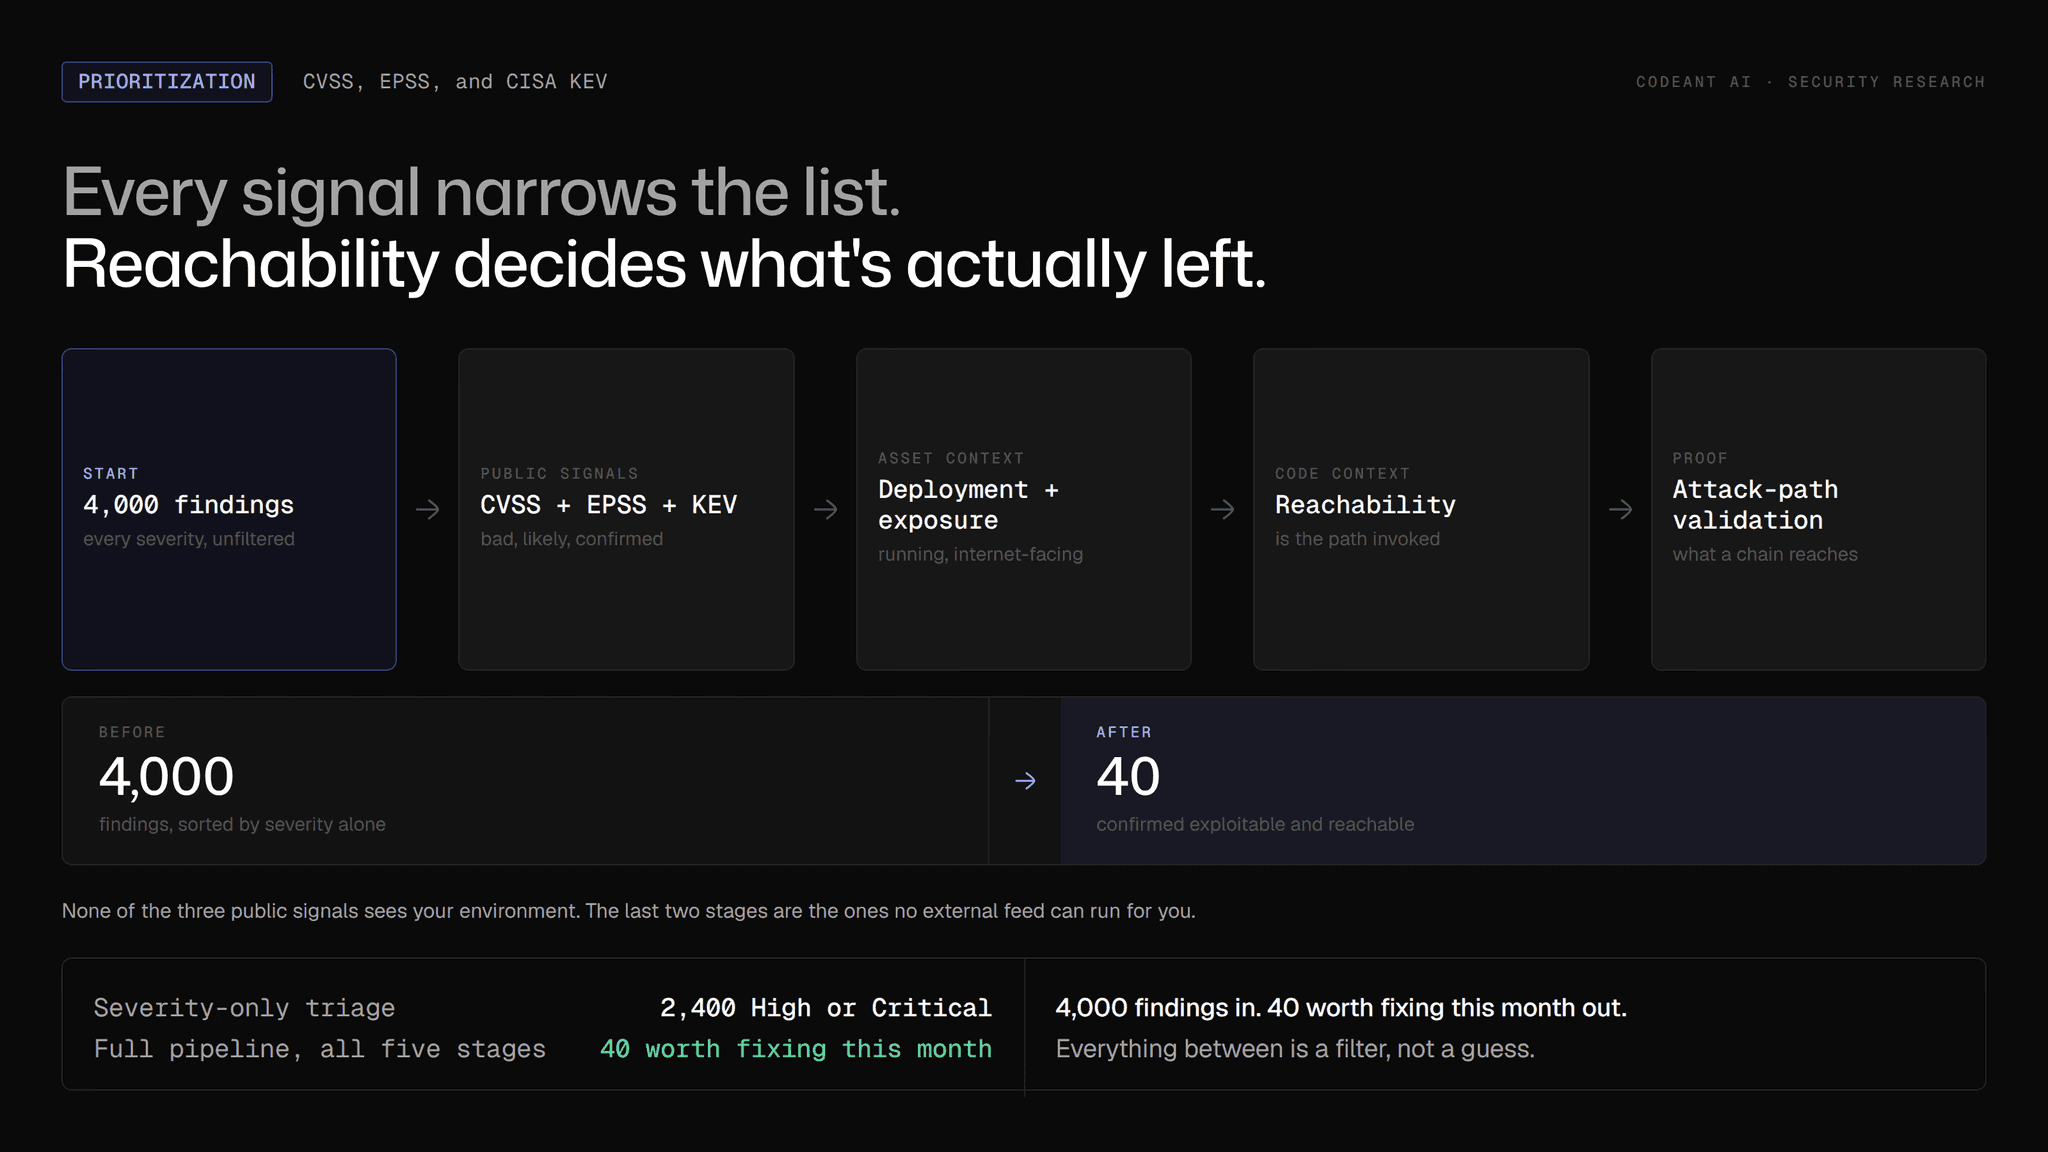
Step 1. Remove what isn't deployed. Don't spend triage time on vulnerabilities in packages or versions that aren't actually running anywhere in your estate. This single step is usually the largest reduction in the whole pipeline.
Step 2. Separate known exploitation. Move every CISA KEV entry that survives step 1 to the top, unconditionally. This is your P0 lane, and it bypasses everything below.
Step 3. Sort the remaining backlog by EPSS. Use EPSS probability, not percentile, to identify which of what's left has meaningful real-world exploitation likelihood.
Step 4. Add severity. Among findings with comparable EPSS scores, use CVSS to distinguish potential impact.
Step 5. Add exposure. Internet-facing assets move ahead of isolated internal components at equivalent severity and likelihood.
Step 6. Validate reachability. For what's left, determine whether the vulnerable code path can actually be invoked given your application's routing and logic.
Step 7. Validate attack paths. Where several surviving findings can be chained, prioritize the chain itself over any individual CVE in it. A chain's severity is not the average of its links.
Step 8. Track deployment, not merge status. Don't close the ticket when the pull request merges. Close it when the vulnerable version is confirmed gone from production, which is the same merged-versus-deployed distinction covered in Zero-Day vs N-Day, and the Patch Window.
Run that sequence once against a real backlog and the 4,000-to-40 reduction stops being a rhetorical opener and becomes an actual number you can defend to whoever's asking why certain Criticals are sitting unfixed.
What Risk-Based Vulnerability Management Looks Like in Practice
Risk-based vulnerability management is the programme-level version of the rule above. It replaces "remediate by severity" with "remediate by modelled risk to this organisation".
Four inputs make it work. The first two are common and the last two rarely are.
Vulnerability data. Which CVEs affect which components. This is what scanners provide.
Threat data. EPSS and CISA KEV, which supply the likelihood dimension.
Asset context. Whether the affected component is deployed, internet-facing, and what data it can reach. This input has the largest effect on the final ranking and is usually the weakest.
Reachability. Whether the vulnerable code path is actually invoked in your configuration. A vulnerable function in a linked library that your SCA tooling flags is a materially different risk when it sits on your primary request path versus a library your application never calls into. That assumes the component was declared in the first place; one your SCA tool never saw, the exact gap covered in SBOM Formats, Tools, and the Binary Gap, can't be assessed for reachability at all.
The honest reporting metric is not open findings, and it is not mean time to remediate. It is the count of vulnerabilities that are both exploitable and reachable, and the trend of that count over time.
Where Vulnerability Prioritization Still Breaks Down
Three failure modes survive even a well-run risk-based programme. Each is worth naming.
Fixed in a repository is not fixed in production
A merged patch and a deployed patch are different claims, and most dashboards only measure the first.
The Liquid Network incident in September 2026 is the clearest recent illustration.
A fix for a consensus-level bug in the Elements codebase was merged to public branches around September 1 to 3, but never shipped in a tagged release.
The exploit landed on September 6 and roughly $320 million in Bitcoin left the network within minutes. Every ticket in that scenario reads as closed. The full breakdown is in CodeAnt's writeup of that attack path, and the merged-versus-deployed distinction is covered more generally in Zero-Day vs N-Day, and the Patch Window.
An unreleased fix is a public exploitation window
Once a security fix is merged in a public repository, the vulnerability is effectively disclosed to anyone reading the commit log, whether or not an advisory exists.
Patch diffing turns that commit into a working exploit in days. Prioritization frameworks that key on CVE publication date systematically miss this window, because the CVE often does not exist yet.
Severity is a property of the chain, not the component
This is the deepest limitation. Every framework in this article scores individual vulnerabilities in isolation. Real compromises are chains.
A low-severity information disclosure that leaks an internal hostname, combined with a medium-severity authorization gap, produces a critical outcome that neither component's score predicts. CodeAnt's own research disclosures against Dolibarr ERP/CRM show this pattern directly: a read route that checked ownership carefully sitting next to a write route, touching the same data, that didn't, covered in the IDOR guide and the Dolibarr findings pillar.
No amount of per-CVE scoring surfaces that. Only validating the path end to end does. Which is the argument for attack path validation alongside prioritization rather than instead of it.
How CodeAnt AI Turns Three Signals Into One Ranked Queue
Most vulnerability tooling stops at one signal, a severity score, a feed, a scanner flag, and leaves you to reconcile the rest by hand. CodeAnt AI covers all three signals from this article on the same row for every CVE, then adds the two that no public feed can give you at all.
Question | Public signal | CodeAnt adds |
|---|---|---|
How severe is it? | CVSS | CVSS |
How likely is exploitation? | EPSS | EPSS |
Is it actively exploited? | CISA KEV | CISA KEV |
Is the asset actually deployed? | — | Asset context |
Is it internet-facing? | — | Attack surface context |
Is the vulnerable path reachable? | — | Reachability |
Can findings be chained? | — | Attack-path validation |
Can exploitation be proven? | — | Agent-based validation |
1. See all three signals on one row
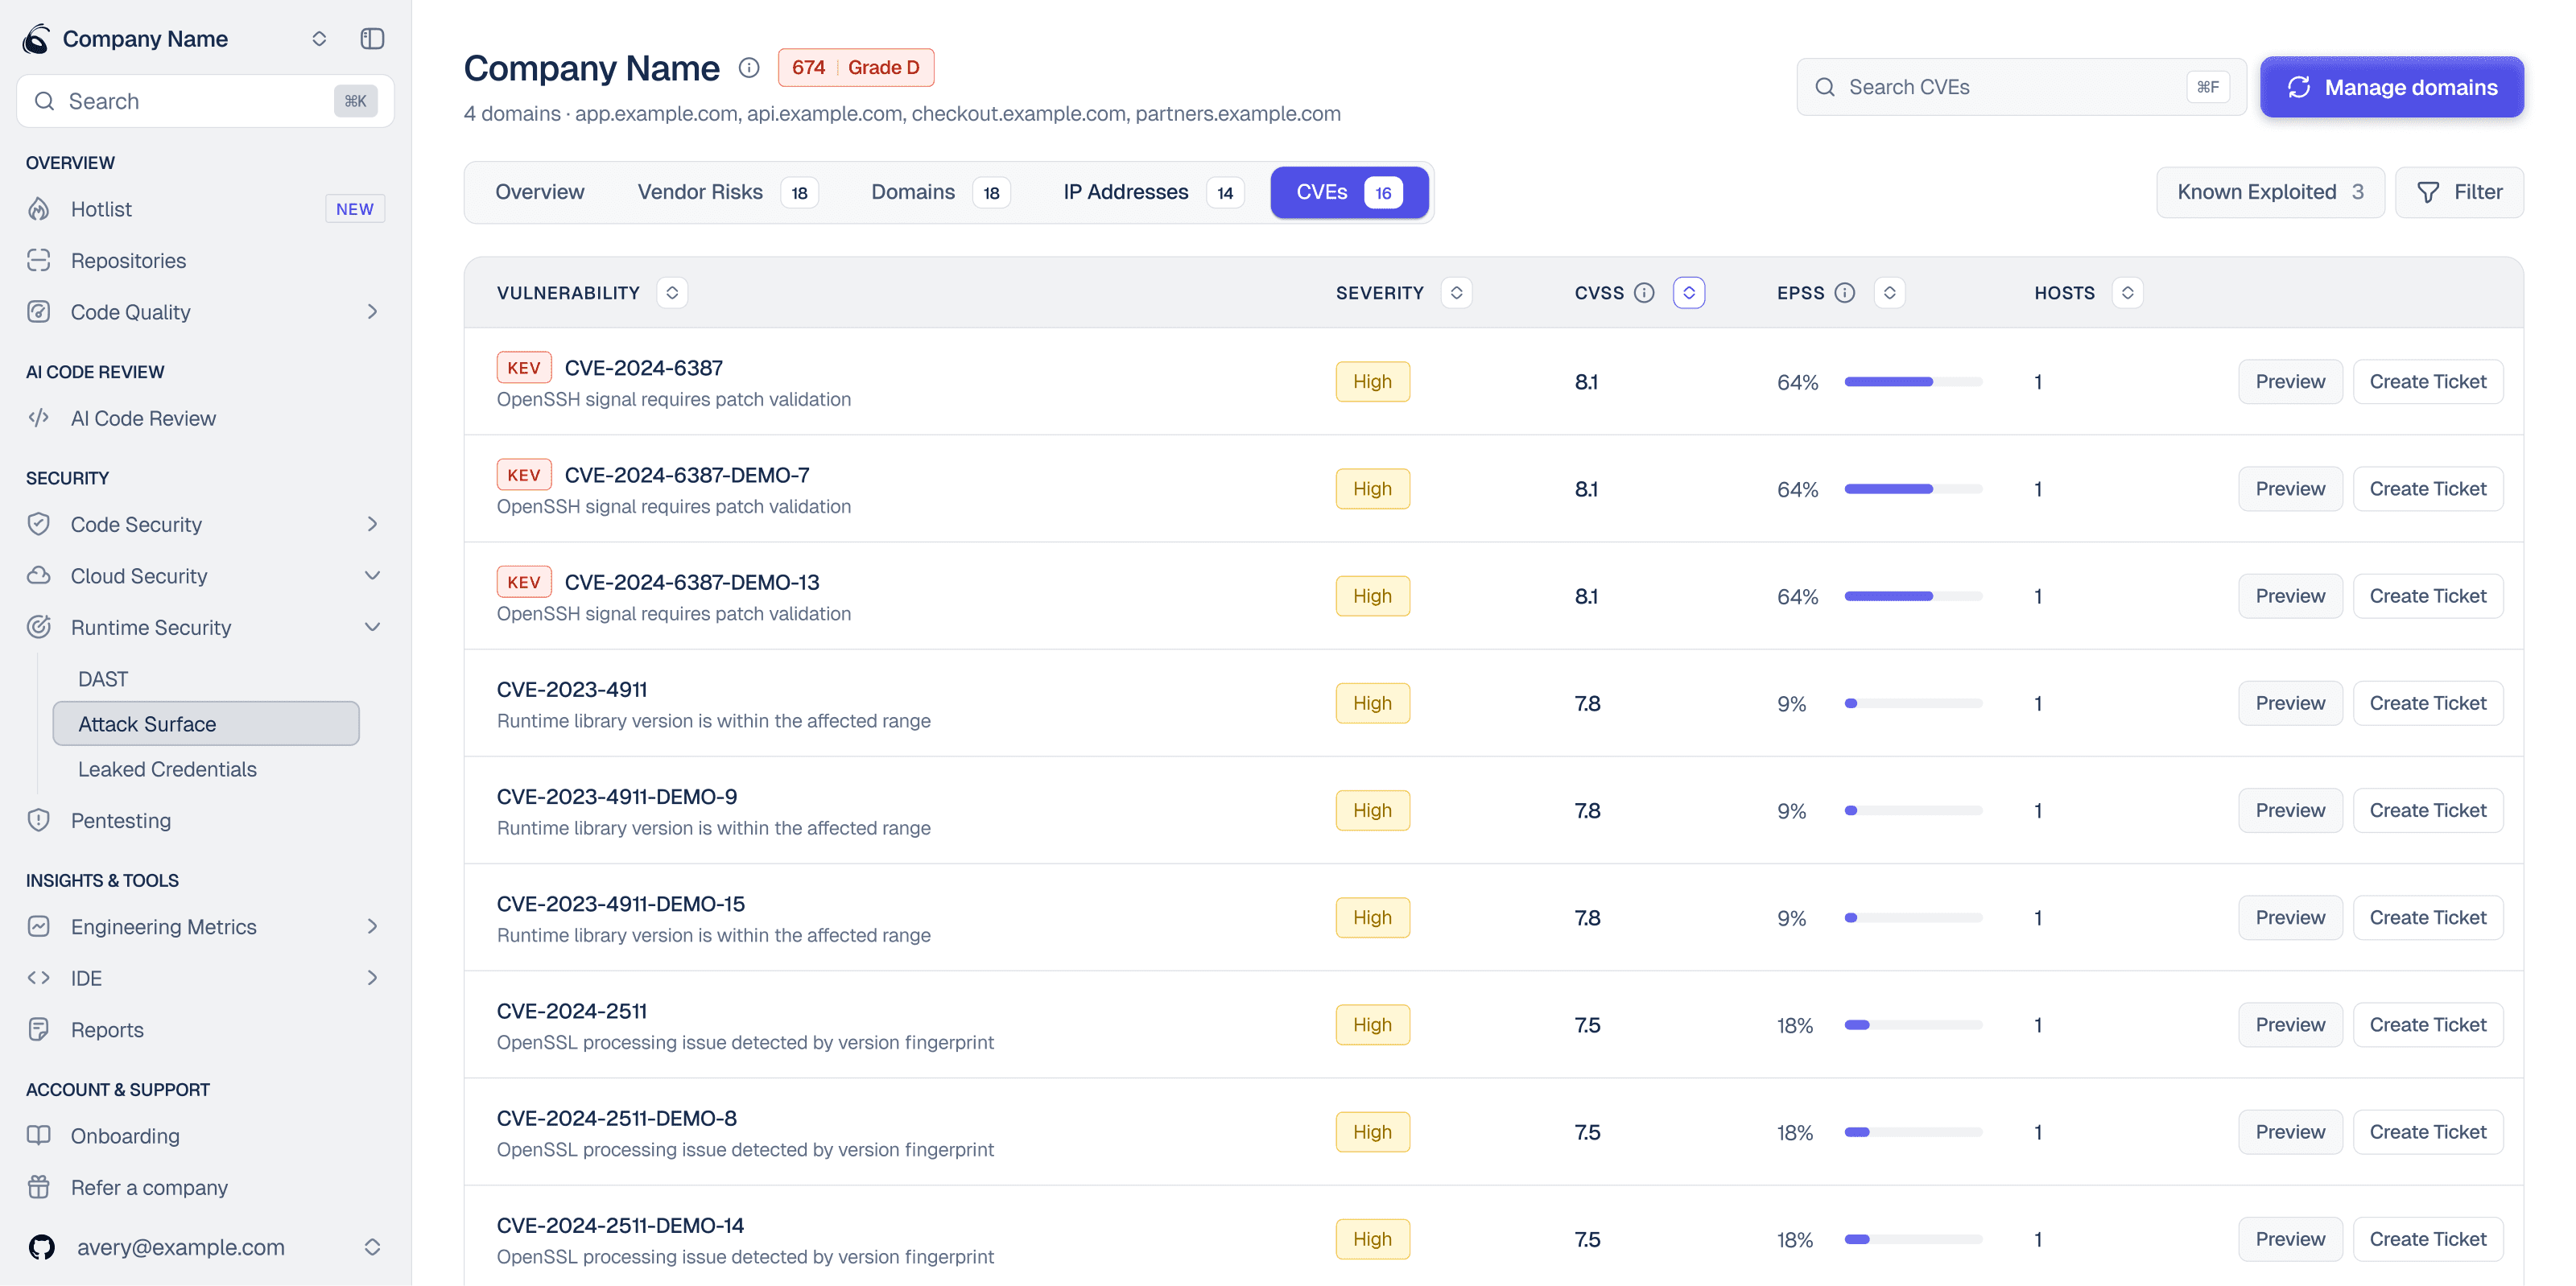
Attack surface management correlates dozens of data sources continuously, including the National Vulnerability Database, the CISA Known Exploited Vulnerabilities catalog, and EPSS scoring. Every CVE carries its CVSS severity, its EPSS percentage, and a known-exploited filter in the same view, which is the three-signal comparison from earlier in this article applied to a live target instead of a spreadsheet.
The cadence is the point. This runs daily rather than on a scan schedule, so a newly published CISA KEV entry against software you run surfaces the same day, not at the next quarterly review.
2. Rank by proximity to data, not raw CVSS
Deterministic scoring in the AI penetration testing pipeline adds the dimension CVSS cannot. Findings are scored by factors including vulnerability weight, target weight, proximity to data, and reachability, so the ranking is auditable rather than a black box. This is the reachability and asset-context rows from the table above, applied automatically instead of assessed by hand.
Two findings with similar severity scores can sit far apart once reachability and target weight are factored in. A defect zero hops from a customer database outranks a higher-CVSS defect three hops away, every time.
3. Prove it, don't just flag it
More than 500 agents chain findings to demonstrate what an attacker actually reaches, on the principle that a detected vulnerability is not a confirmed leak. This is the attack-path-validation and agent-based-validation rows, the two the public signals have no answer for at all.
That's one turn of a longer loop that runs continuously across CodeAnt's customer base: model the attack surface, attack it, prove what's reachable, fix and reset, learn from what held, processing roughly 15 billion security events a month. The learning step is why this compounds rather than resets on every scan.
Internal findings, your code, your dependencies, your specific configuration, stay private to your account, but a verified, externally-reachable exploit pattern gets abstracted and reused to re-score every other customer with matching exposure.
A CVE that's actually exploitable in one customer's stack sharpens the priority ranking for everyone else running the same package before it's a confirmed problem for them too.

For context on what scoring alone misses, CodeAnt's research team has disclosed 150+ CVEs, including CVE-2026-29000, a CVSS 10.0 authentication bypass in pac4j-jwt that sat in reviewed, widely deployed code undetected for six years, in a package that sits in the dependency tree behind a share of the 2B+ monthly downloads that finding's blast radius covers.
For as long as that bug went unfixed, it carried no CVE, no CVSS score, no EPSS probability, and no CISA KEV entry, because none of those three signals can rank a vulnerability nobody has found yet. That is the honest limit of everything this article covers: the three signals prioritize your known backlog. Finding what isn't in it yet is a separate problem.
Seven Vulnerability Prioritization Mistakes
Most of these are implicit elsewhere in this article. Stated as a list, they're easier to check a team's actual process against.
Fixing every Critical CVE first, regardless of deployment or exposure. Severity without context is the mistake this entire article is a correction for.
Treating EPSS percentile as if it were the probability. A 0.95 percentile is a relative rank. A 0.05 probability is an absolute number. They answer different questions and shouldn't be compared to a single threshold interchangeably.
Ignoring CISA KEV, or treating it as just another feed. It's the only one of the three signals that's an observation rather than a model, which is why it overrides the other two.
Prioritizing software that isn't actually deployed. The single highest-leverage filter in the whole pipeline, and the easiest one to skip.
Ignoring internet exposure as a factor. Two findings with identical CVSS and EPSS scores are not equivalent risk if only one is reachable from outside the network.
Closing a vulnerability when the fix merges rather than when it deploys. Covered at length in Zero-Day vs N-Day, and the Patch Window; a merged, undeployed fix is not a closed finding.
Scoring vulnerabilities individually instead of looking for chains. The deepest limitation in this article's own framework. A chain of individually-moderate findings can be more dangerous than any single Critical.
The Vulnerability Prioritization Checklist
Data foundations
Ingest all three signals. CVSS from NVD, EPSS daily from FIRST, and the CISA KEV catalog. Two out of three is the common failure.
Record the CVSS version alongside every score. A v3.1 and a v4.0 number are not directly comparable.
Use EPSS probability for thresholds and percentile for ranking. Do not mix them.
Context
Gate on deployment status before anything else. An unrun component is not a finding.
Flag internet-facing assets as a separate dimension rather than folding them into severity.
Establish reachability for your top findings. If you cannot answer whether the vulnerable path is invoked, that is the gap to close first.
Operations
Calibrate thresholds to actual throughput. Measure how many items you close per cycle and set the line there.
Re-score on a schedule, because EPSS moves daily and CISA KEV grows.
Track merged versus deployed as distinct states in your workflow.
Document every acceptance with a named owner and a review date.
Reporting
Report exploitable and reachable counts, not open finding counts.
Report your patch window, measured from public fix availability to full deployment.
Stop Sorting by Severity. Start Sorting by What's Actually Reachable
Severity alone was never going to work, not because CVSS is a bad number, but because it was never designed to answer the question a 4,000-finding backlog actually asks: which of these can someone reach, and which of those are they likely to use?
CVSS, EPSS, and CISA KEV answer three real pieces of that question, cheaply and in public. Reachability and chain awareness are the two pieces no external feed will ever hand you, because they live entirely in your own architecture.
Where to start this week
Pull your current High and Critical backlog and run it through steps 1 and 2 from this article's practical workflow: strip out anything not actually deployed, then pull every CISA KEV match to the top regardless of its CVSS score. For most teams that alone cuts the list by more than half before EPSS or reachability even enters the picture. Do that by hand once so you know what the honest number looks like, then decide whether it's worth automating.
Running that sequence continuously, correlated against a live NVD, CISA KEV, and EPSS feed, then validated against what's actually reachable in your environment, is what CodeAnt AI's attack surface management automates end to end. See your real priority queue →
Related reading
CVE and NVD Data Explained: how the underlying identifiers and enrichment pipeline actually work.
Zero-Day vs N-Day, and the Patch Window: the merged-versus-deployed gap in more depth.
The IDOR guide: a real, disclosed example of a chain that no single CVSS score would have flagged as critical.

